

For decades, the Bradford assay has been the go-to workhorse for rapid protein quantification. The concept is elegantly simple: you mix your protein sample with a Coomassie Brilliant Blue dye, and the solution shifts from a red-brown to a vibrant blue.
This color change, which you measure at 595 nm with a spectrophotometer, is directly proportional to the protein concentration in your sample. It's a quick, straightforward method that has stood the test of time for a reason.
Why the Bradford Assay Is Still Essential in Modern Labs
Even with all the high-tech proteomics tools available today, the Bradford assay remains a non-negotiable part of the workflow in high-stakes biomanufacturing and cell culture labs. Why? Two words: speed and simplicity. For teams working with mammalian cells, getting reliable protein data in minutes—not hours—is a game-changer.
This rapid feedback is invaluable. It gives you a near-instant check on protein expression in a new cell line, confirms batch consistency in production, or validates your purification yields at every single step. The Bradford protocol delivers these critical checkpoints without needing complex equipment or long, drawn-out procedures, making it a powerful tool for anyone focused on efficiency.
A Legacy of Speed and Simplicity
When Marion M. Bradford introduced his assay back in 1976, it completely changed the landscape of protein quantification. It slashed measurement times from nearly two hours down to a mere 5-10 minutes per sample. This was all thanks to its simple mechanism, where Coomassie Brilliant Blue G-250 dye binds to proteins and shifts its peak absorbance—a change that’s easy to read on any standard spectrophotometer. You can dig into the specifics in the foundational research on the Bradford protein assay.
This speed is especially critical for teams that need to make decisions on the fly. Think about companies that supply a huge range of cell culture reagents, from media to sera. They rely on assays like this to run quality control on their protein-based products, ensuring everything is consistent from the R&D bench all the way to bioproduction.
Key Takeaway: The real power of the Bradford assay is its ability to deliver fast, reliable protein concentration data. That speed empowers you to make quicker decisions, troubleshoot problems in real-time, and keep your high-throughput workflow moving.
Practical Applications in Mammalian Cell Culture
In the world of mammalian cell research and biomanufacturing, the Bradford assay is far more than just a measurement—it’s a workflow accelerator. Here are just a few real-world scenarios where it becomes indispensable:
- Monitoring Protein Expression: Get a quick answer on whether your transfected cells are actually producing the target recombinant protein before you commit to more expensive downstream work like a Western blot.
- Optimizing Lysis Conditions: You can easily test a dozen different cell lysis buffers by measuring the total protein yield, letting you pinpoint the most effective protocol for your specific cell type.
- Validating Purification Steps: After each chromatography run, you can rapidly check the protein concentration in every fraction. This lets you track yield and purity on the spot, not hours later.
- Normalizing Samples: It's the simplest way to make sure you load equal amounts of protein for your comparative experiments, like ELISAs or enzyme activity assays. This is absolutely critical for generating data you can actually trust.
By integrating this classic technique into your daily lab routine, you can seriously improve your reproducibility and gain much more confidence in your results.
Preparing Reagents and Standards for Accurate Results
The accuracy of your Bradford assay is decided before you even add the first drop of reagent to your plate. It all comes down to preparation. Flawless handling of your reagents and standards isn't just a best practice; it's the absolute foundation for getting data you can trust.
Think of it like building a house: if the foundation is crooked, everything you build on top of it will be compromised. In this assay, your dye and your protein standards are that foundation. Skimp on the details here, and you’ll be chasing your tail with skewed curves and inaccurate results.
Handling the Coomassie Dye Reagent
The star of the show is the Coomassie Brilliant Blue G-250 dye. While buying a commercial reagent is convenient, it's not invincible. These reagents have a shelf life and require proper handling to perform as expected.
- Check for Degradation: Fresh Bradford reagent should be a reddish-brown color with a slightly acidic smell. If you open your bottle and see a dark blue or even purple hue, the dye has already started to break down. This will give you sky-high background readings and ruin your assay. Toss it and open a new bottle.
- Storage is Key: Always store the dye reagent at 4°C in the dark. The cold temperature slows the natural degradation process, and keeping it out of the light prevents photochemical reactions that will kill its performance.
- Bring to Room Temperature: Before you start pipetting, let the reagent sit on the bench and warm up to room temperature for at least 30 minutes. Using cold reagent slows down the binding reaction, which will lead to lower absorbance values and artificially low concentration readings.
These simple checks take minutes but can save you hours of troubleshooting a failed experiment later.
Creating a Reliable BSA Standard Curve
Your standard curve is the ruler you'll use to measure every unknown sample. While other proteins can be used, Bovine Serum Albumin (BSA) is the go-to standard for most labs because it's cheap, stable, and readily available. Nailing the serial dilution for your standards is non-negotiable.
You'll start with a concentrated stock solution. A 1 mg/mL (1,000 µg/mL) BSA stock is a good, easy-to-work-with concentration. You can buy pre-made, QC-tested solutions or make your own by dissolving high-purity BSA powder in your buffer of choice.
Pro Tip: Always, always prepare your BSA standards in the exact same buffer as your unknown protein samples. Buffer mismatch is one of the most common—and easily avoidable—sources of interference in a Bradford assay. Different buffer components can dramatically alter the dye's response and throw off your quantitation.
From this stock, you'll prepare a series of dilutions that span the linear range of your assay. For a standard microplate format, a range from 0 to 1,400 µg/mL provides a solid curve. Use properly calibrated pipettes and be meticulous. It's also worth noting that the quality of your buffers, which depends on pure water, is critical. Using a high-quality Lab Water Purifier For Distilled Water is an easy way to eliminate a major source of variability from the start.
To help you get started, here's a standard dilution series for preparing a robust curve from a 1 mg/mL BSA stock. This is a great template for a typical microplate assay.
BSA Standard Dilution Guide for a 1 mg/mL Stock
| Standard Label | Final BSA Concentration (µg/mL) | Volume of 1 mg/mL BSA Stock (µL) | Volume of Dilution Buffer (µL) | Total Volume (µL) |
|---|---|---|---|---|
| S1 | 1,400 | 140 | 60 | 200 |
| S2 | 1,000 | 100 | 100 | 200 |
| S3 | 700 | 70 | 130 | 200 |
| S4 | 500 | 50 | 150 | 200 |
| S5 | 250 | 25 | 175 | 200 |
| S6 | 125 | 12.5 | 187.5 | 200 |
| S7 | 0 (Blank) | 0 | 200 | 200 |
This series gives you a nice spread of data points to ensure your curve is linear and accurate. The "blank" standard, which is just your buffer, is absolutely essential. It allows you to zero the spectrophotometer and subtract any background absorbance coming from the dye or the buffer itself. Get this part right, and you've set the stage for a successful assay.
With your standards and reagents prepped and ready to go, it's time to head to the bench and run the assay. This is where your careful technique and consistency really pay off, turning those well-made components into reliable, publication-quality data.
The workhorse method for most labs today is the 96-well microplate format. It’s fast, efficient, and sips only a tiny amount of your precious sample. That said, the classic, larger-volume cuvette method definitely still has its place, especially when you only have a few samples to test or don't have a plate reader handy. We'll walk through both.
This diagram lays out the whole process, from making your stock solution all the way to the final dilution series ready for your plate.
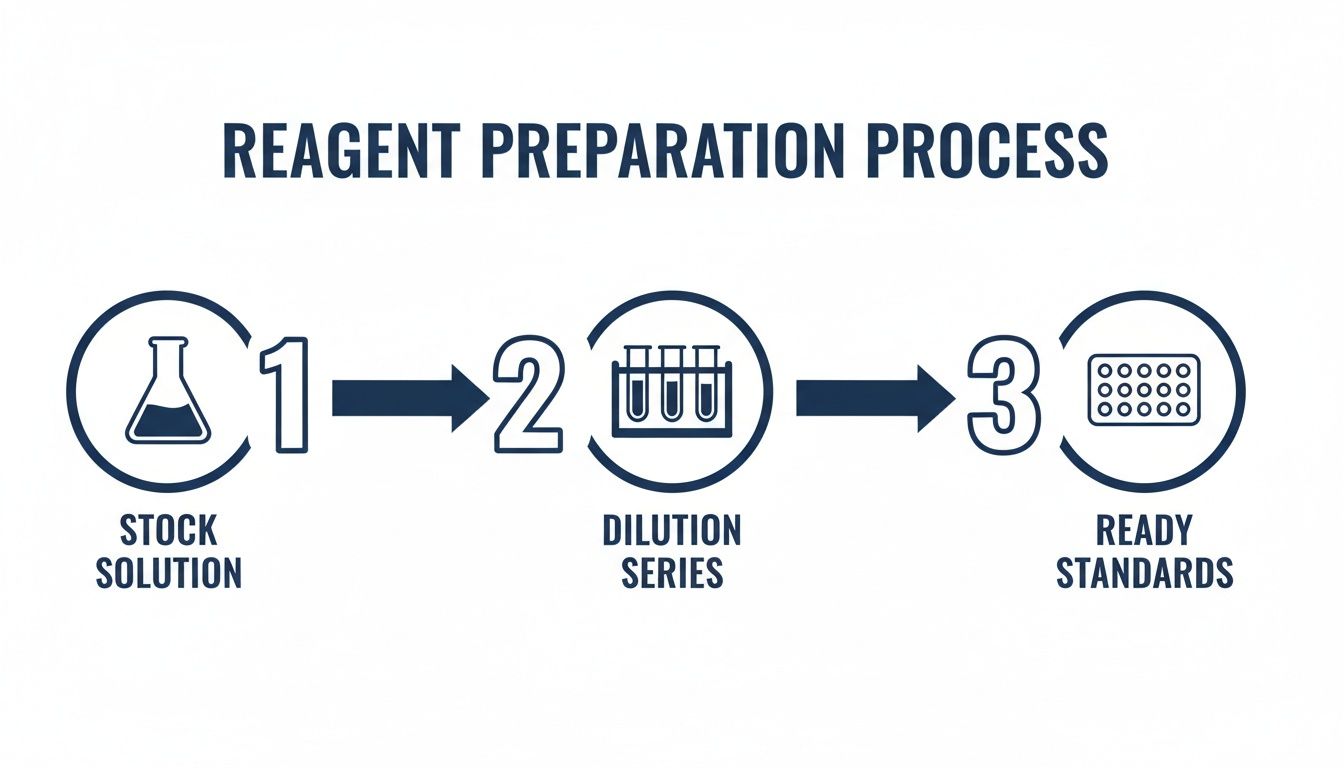
As you can see, a precise dilution series, all stemming from a single, trusted stock, is the bedrock of a good standard curve.
The High-Throughput Microplate Protocol
The 96-well plate is the engine of modern protein quantification. It lets you blaze through dozens of samples at once, but it demands precision. Your results are only as good as your pipetting, which is why mastering pipette calibration is a skill every serious researcher needs.
Here’s a practical workflow that we use in our lab:
Map Your Plate: Before you uncap a single tube, map out your 96-well plate. Assign wells for your blank, your full standard curve (S1 to S7), and all your unknown samples. The most critical part? Plan to run everything in triplicate. This is non-negotiable for catching errors and getting a solid standard deviation.
Load Samples & Standards: Carefully pipette 10 µL of each standard and unknown sample into its designated well. Technique matters here. Keep the tip just below the liquid surface and dispense slowly to prevent splashing or creating bubbles.
Add the Reagent: Now for the main event. Using a multichannel pipette will make this much faster. Add 200 µL of your room-temperature Bradford dye to every single well. Use a bit of force when you dispense to kickstart the mixing. You'll see the color change instantly.
Incubate & Read: Let the plate sit at room temperature for 5 to 10 minutes. While the color is stable for about an hour, consistency is what counts. Always read your plates after the same incubation time. Set your microplate reader to measure absorbance at 595 nm.
Pro Tip: Bubbles are the enemy of accurate absorbance readings. After adding the reagent, give the plate a quick visual check. If you spot any bubbles, gently pop them with a clean pipette tip before putting the plate in the reader.
When to Use the Classic Cuvette Method
While the microplate format gets most of the attention, the old-school cuvette method is still incredibly useful. It's my go-to when I only have a handful of samples or when I suspect the protein concentration is extremely low. The longer 1 cm path length of a standard cuvette can give you a sensitivity boost.
The process is refreshingly simple:
- Add 50 µL of your standard or sample to a clean 1.5 mL microfuge tube.
- Add 1.5 mL of Bradford reagent to the tube.
- Give it a quick vortex to mix thoroughly, then incubate at room temp for at least 5 minutes.
- Transfer the mixture to a clean cuvette and read the absorbance at 595 nm.
Just don't forget to zero the spectrophotometer first with a blank. Your blank should contain the same buffer as your samples, mixed with the Bradford reagent.
The Undeniable Power of Triplicates
Running samples and standards in triplicate might feel like extra work, but it's the only way to generate data you can actually trust. Triplicates let you calculate a meaningful average and, more importantly, a standard deviation for every data point.
If one of your replicates gives a reading that's wildly different from the other two, you have a clear outlier. You can confidently toss that data point out, saving your entire experiment from being ruined by a single pipetting mistake. It's your built-in quality control.
Analyzing Data and Calculating Protein Concentration
You’ve run the assay, and now you have a plate full of blue wells and a spreadsheet of raw absorbance numbers. On their own, these numbers are meaningless. The real work of the Bradford assay happens now, where you turn those raw optical density (OD) readings into solid, reliable protein concentrations.
This isn't just about plugging numbers into a formula. It's about interrogating your data to make sure your conclusions are built on a rock-solid foundation. Let’s walk through how to do this right, using tools like Excel, and how to spot problems before they torpedo your results.
Building and Validating Your Standard Curve
First things first, you need to process the data from your standards. This means calculating the average of your triplicate readings for each BSA concentration and then performing the single most critical step: subtracting the average absorbance of your blank (the "0 µg/mL" standard) from every single one of your other readings—both standards and samples.
Why You Must Blank-Correct Everything: The blank’s absorbance is the baseline color of your dye mixed with your buffer. If you don't subtract this value from all your other readings, you will artificially inflate every single result. Your entire standard curve will shift upwards, leading to systematically inaccurate protein calculations.
With your blank-corrected values in hand, it’s time to plot your curve.
- X-Axis: Known Protein Concentration (µg/mL) of your BSA standards.
- Y-Axis: Blank-Corrected Absorbance at 595 nm.
Any standard spreadsheet software, like Microsoft Excel or Google Sheets, can generate a scatter plot and fit a linear trendline in a few clicks. When you add that trendline, make sure you display two crucial pieces of information on the chart: the equation and the R-squared (R²) value.
The Importance of the R-Squared Value
The R² value is your most important quality control checkpoint. It tells you how well your data points fit the straight line—in other words, just how linear and trustworthy your standard curve actually is.
For any reliable Bradford assay, you should be aiming for an R² value of 0.99 or higher. An R² of 0.995 or better is a sign of excellent, consistent pipetting and accurate dilutions. If your R² value dips below 0.98, it’s a major red flag. Something went wrong—a pipetting error, a bad standard, maybe a bubble in a well. You should seriously consider repeating the assay.
A Worked Example of Protein Calculation
Once you have a valid curve with a high R² value, the software will provide an equation in the classic y = mx + b format.
- y is the blank-corrected absorbance of your unknown sample.
- m is the slope of the line.
- x is the protein concentration—the value you’re solving for.
- b is the y-intercept.
Let's say your trendline equation is y = 0.0015x + 0.045, and your unknown sample has a blank-corrected average absorbance of 0.495. To find its concentration, you just need to rearrange the equation and solve for x:
- Start with the equation: 0.495 = 0.0015x + 0.045
- Isolate the x term: 0.495 – 0.045 = 0.0015x
- Simplify: 0.45 = 0.0015x
- Solve for x: x = 0.45 / 0.0015
- Result: x = 300 µg/mL
This is the concentration of the protein in the diluted sample you actually added to the well. Don't forget the final step: if you diluted your original sample before the assay, you must multiply this result by your dilution factor. For a 1:10 dilution, the concentration of your original stock solution is 300 µg/mL * 10 = 3,000 µg/mL, or 3 mg/mL.
It's just as important to know what to do with samples that fall outside your curve's linear range. If a sample’s absorbance is higher than your top standard, you cannot trust the calculated value. That sample absolutely must be diluted further and re-assayed to ensure its reading falls squarely within the validated range of your standard curve.
Troubleshooting Common Issues and Interferences
Let's be honest. The Bradford assay is a lab workhorse, but some days it just doesn't cooperate. One afternoon your standard curve is a thing of beauty, the next it’s a complete mess. When your results look questionable, you need a quick diagnostic plan.
This is your field guide for fixing the most common issues that plague the Bradford assay. We’ll walk through everything from wobbly replicates to high background, pinpointing the likely culprits so you can get back to generating data you can actually trust.
Identifying the Root Cause of Inaccurate Results
When your standard curve has a poor R² value or just looks wrong, it's time to play detective. More often than not, the problem starts with your prep work.
Did you let the Bradford reagent warm up to room temperature? Using it straight from the fridge is a classic mistake. The cold slows down the reaction kinetics, which can give you artificially low absorbance readings across your entire plate.
The standards themselves are another frequent offender. If your serial dilutions weren't pipetted with care, or if that old BSA stock has started to degrade, your entire curve is built on a faulty foundation. Always, always use freshly prepared standards and be meticulous with your pipetting.
And if you're seeing inconsistent results between your replicates, your pipetting technique is almost certainly the problem. Tiny volume differences, bubbles in the wells, or failing to mix each well thoroughly will introduce the exact kind of variability you're trying to avoid.
Managing Common Interferences in Cell Culture Samples
The Bradford assay’s biggest weakness is its sensitivity to chemicals commonly found in cell lysis buffers. This becomes a major headache when you're working with mammalian cell lysates, since those buffers are often packed with detergents and have a high pH.
Detergents are the Main Offender: Non-ionic detergents like Triton X-100 and ionic ones like SDS are notorious for interfering. Even at low concentrations, they can cause the dye to precipitate or create a high background signal, completely throwing off your readings.
Basic Buffers Cause Problems: The Bradford reagent is acidic. If your sample buffer is strongly basic (think high concentrations of Tris), it can raise the pH of the final reaction. This disrupts the assay's core chemistry, often turning the solution dark blue even before you add any protein.
Key Takeaway: The single most important thing you can do to avoid interference is to prepare your BSA standards in the exact same buffer as your unknown samples. This ensures that whatever effect the buffer has on the dye, it's consistent across both your standards and samples, effectively canceling it out.
If interference is still an issue, diluting your sample is your next best move. Assuming your protein is concentrated enough, a simple 1:10 or 1:20 dilution can often bring the concentration of pesky substances like Triton X-100 down to a manageable level.
A significant leap forward came from a 2011 NIH study, which found that you could dramatically improve results by linearizing them. The trick is to ratio the absorbances at 590 nm and 450 nm. This dual-wavelength method boosted sensitivity 10-fold, allowing researchers to detect as little as 50 ng of BSA—a lifesaver for low-yield samples. The improved Bradford assay protocol also slashed detergent interference from agents like Triton X-100 or SDS by up to 80%, a common frustration for labs using the kind of tissue culture services provided by specialists like PurMa Biologics. You can dive into all the specifics in the full NIH research paper.
When things go wrong, a systematic approach is your best friend. Start by checking for the simple, easy-to-fix issues before you start considering more complex solutions like dialyzing your samples.
Sometimes, a quick-reference table is exactly what you need to diagnose a problem in the middle of an experiment. Here are the most frequent issues we see and how to fix them.
Common Bradford Assay Problems and Solutions
| Problem Observed | Potential Cause | Recommended Solution |
|---|---|---|
| High Background Reading | Interfering substance in the buffer (e.g., detergents like SDS or Triton X-100). | Prepare standards in the same buffer as samples. If that fails, dilute the sample to reduce the interferent concentration. |
| Precipitate Forms in Wells | High protein concentration, or detergent interaction with the dye. | Dilute the sample. Ensure detergents are below the maximum recommended concentration for your specific reagent. |
| Poor R² Value / Non-Linear Curve | Inaccurate standard dilutions; degraded BSA stock; reagent not at room temp. | Prepare fresh standards from a reliable BSA stock. Always allow the reagent to equilibrate to room temperature before use. |
| Inconsistent Replicates | Pipetting error (inaccurate volumes, bubbles); insufficient mixing in wells. | Be meticulous with pipetting. Use calibrated pipettes. Ensure each well is mixed thoroughly after adding the reagent. |
| Low Absorbance Readings | Protein concentration is too low; insufficient incubation time; cold reagent used. | Concentrate the sample if possible, or switch to a micro-assay format. Ensure you follow the recommended incubation time. |
| Color Develops in Blank Wells | Sample buffer is too basic (e.g., high Tris concentration), raising the assay's pH. | Prepare standards and blank in the same buffer. If the problem persists, you may need to buffer-exchange your sample. |
Running through this checklist can save you a ton of time and frustration, helping you quickly identify whether the issue is with your technique, your samples, or your reagents.
Bradford Assay Protocol: Your Questions, Answered
Even a routine assay like the Bradford has its quirks. When you're at the bench, questions pop up. Here are some of the most common ones we hear, with practical answers to keep your workflow moving and your data clean.
What If I Don't Have BSA for My Standards?
While Bovine Serum Albumin (BSA) is the go-to protein standard for a reason, it's not your only choice. If you've run out, or if you know your protein of interest has a wildly different amino acid composition, switching standards can actually improve your accuracy.
Immunoglobulin G (IgG) is a fantastic alternative, especially if you're quantifying antibodies. The core principle is what matters: whatever you pick, use it consistently for every single assay you want to compare. Your chosen standard should ideally react to the dye in a similar way as your target protein.
Pro Tip: The absolute best-in-class standard is a purified, highly concentrated stock of your actual protein of interest. It's not always practical to make, but if you have it, use it. This eliminates almost all the variability from differences in dye-binding between the standard and your sample.
How Should I Store My Lysates Before the Assay?
Protein integrity is everything. Once you've lysed your cells and spun down the debris, that clarified supernatant is a ticking clock—proteases are active and degradation has begun.
- For same-day assays: Keep your prepared samples on ice. Simple as that.
- For longer-term storage: If you're not running the assay today, you need to freeze your samples properly. Add a good protease inhibitor cocktail to your lysate, aliquot it into single-use tubes to kill the temptation of freeze-thawing, and store them at -80°C.
When it's time to run the assay, thaw the samples quickly but keep them on ice right until the moment you pipette them into your plate.
Can I Just Read My Plate Later?
No. The beautiful blue color you see in a Bradford assay is temporary. It’s stable for about an hour, but this is not a true endpoint assay where the signal holds steady indefinitely. Over time, the dye-protein complexes will start to precipitate out of solution, causing your absorbance readings to drift down.
For the most consistent and reproducible data, you need to read your plate within 5 to 20 minutes after adding the Bradford reagent. More importantly, read every plate after the exact same incubation time in every experiment. Consistency is what separates good data from great data. An assay read at 5 minutes cannot be reliably compared to one you let sit for 30 minutes.
At PurMa Biologics, we know that reliable data begins with high-quality, consistent reagents. From our endotoxin-controlled water to our deep library of buffers and cell culture media, we provide the foundational tools you need to get reproducible results, every time. Explore our full range of products at https://www.purmabiologics.com.